How to create a Node.js app with Docker, Part 3: Debugging

In the previous posts, we've learned how to manage the deployment and the development of a Node.js application by using Docker. But, as we all know, when an application grows the code, the variables, the flows do the same and so the debugging becomes a decisive activity to analyze the application, fix bugs and enhance the performances.
Now we'll examine different ways to debug the application and its execution environment by using Docker's features and Node.js' live debugger.
Prerequisites
The
Dockerfile,index.jsandpackage.jsonfiles used in the previous posts.Visual Studio Code. I chose it as debugging client to use in this post because it is very popular and flexible as IDE for the Javascript ecosystem (and not only). Obviously, when you understand how to configure it, it will be easy to do also for other clients.
Checking the container
If you wish to get more information about container's settings, you can use
$ docker inspect <CONTAINER ID>
[
  {
    "Id": "0e46f33ada2544247c6ec3e12eb6ac782b5b083fc4b4b28b54fe1432e11705ef",
    "Created": "2019-07-02T22:16:41.680373653Z",
    "Path": "npm",
    "Args": [
      "start"
    ],
...
From here you can see the environment variables, mounted volumes, ports mapping and so on. If you are interested to know what instructions were used to build an image, you can execute
$ docker history <IMAGE NAME>
IMAGE          CREATED          CREATED BY                                      SIZE    COMMENT
21c4b1c3caa6   13 minutes ago   /bin/sh -c #(nop)  ENTRYPOINT ["npm" "start"]   0B
184e7d2e01d2   13 minutes ago   /bin/sh -c #(nop) COPY dir:0f185e89d258ae6b2…   2.02kB
6ef474952ee5   13 minutes ago   /bin/sh -c npm install                          11.5MB
d47428ad6508   14 minutes ago   /bin/sh -c #(nop) COPY file:d5ccac30a20f01f2…   270B
57cb52807557   14 minutes ago   /bin/sh -c #(nop) WORKDIR /app                  0B
Moreover to see the running processes in the container
$ docker top <CONTAINER ID>
UID    PID    PPID   C    STIME   TTY   TIME       CMD
root   4800   4779   10   22:16   ?     00:00:00   npm
root   4848   4800   0    22:16   ?     00:00:00   sh -c node index.js
root   4849   4848   6    22:16   ?     00:00:00   node index.js
These commands allow you to have a quick overview of the container and check easily if there were errors during its creation and launch.
Seeing the logs
Before to proceed, let's add a simple log in our application by editing the index.js file
var express = require('express')
var app = express()
var port = process.env.PORT || 3000

app.get('/', function (req, res) {
  console.log('[' + new Date().toISOString() + '] Request for homepage')
  res.send('Hello World!')
})

app.listen(port)
Rebuild the image and start the container. To see the logs emitted by our app we just need to run the command
$ docker logs <CONTAINER ID>

> nodejs-app@ start /app
> node index.js

[2019-07-05T22:03:10.234Z] Request for homepage
As you can notice, the command shows the output of process launched by the ENTRYPOINT instruction, in this case npm start. Every time you access to app's homepage, you'll see a newly added log. If you want to attach your terminal's STDIO (input/output channel) to the process and let the logs be emitted in the terminal directly without having to rerun the above command, you can use
$ docker attach <CONTAINER ID>
Editing the entrypoint
We may need to use a different command for the ENTRYPOINT instruction on the fly. Just think, for example, when an error is throwed by the command making the container' launch fail or when we want to start the application in a different mode. We can modify the command when the container is started in 2 ways:
- Passing arguments to it
$ docker run -d -p 4000:3000 nodejsapp arg1 arg2
- Override the
ENTRYPOINTinstruction
$ docker run -d -p 4000:3000 --entrypoint npm nodejsapp install --verbose
In the example, we replaced the instruction's command with npm install --verbose. Notice that every command's argument must be put at the end.
To see what command was used in a container's entrypoint, we can check the field COMMAND in the container list.
$ docker ps
CONTAINER ID   IMAGE       COMMAND                 CREATED         STATUS         PORTS                    NAMES
de5cfbb0ee14   nodejsapp   "npm start arg1 arg2"   2 minutes ago   Up 2 minutes   0.0.0.0:4000->3000/tcp   vigilant_feistel
Executing commands in the container
We often need to execute specific commands in the container. Also for this, we have two ways:
- Using the
execcommand
$ docker exec <CONTAINER ID> node --version
v10.15.3
- Override the entrypoint command as seen before to start an interactive shell connected to the container
$ docker run -it --entrypoint /bin/sh nodejsapp
An advantage of overriding the entrypoint is that we can prevent the container's launch from failing due to an error and keep it active as long as we want.
Pausing the container
Another nice feature, useful for example if we want to consult verbose logs little by little, is pausing all running processes in the container
$ docker pause <CONTAINER ID>
and resume them when we want
$ docker unpause <CONTAINER ID>
Live debugging
To examine in depth and efficiently the flows and the variables while our application is running, we need a good debugger. Node.js already includes a debugger which can be used with a client of our choice, in this case Visual Studio Code.
Firstly let's add a script in the package.json to launch our application in debug mode and create a new build of image.
Note: You can use this kind of commands without rebuilding the image but only overriding the entrypoint when the container is started as seen before.
{
  "name": "nodejs-app",
  "dependencies": {
    "express": "^4.17.0"
  },
  "scripts": {
    "start": "node index.js",
    "dev": "npx nodemon index.js",
    "debug": "node --inspect=0.0.0.0:9229 index.js"
  },
  "devDependencies": {
    "nodemon": "^1.19.1"
  }
}
The --inspect flag allows the communication between a Node.js process and a debugger. It accepts two options to define the host (e.g. 0.0.0.0) and the port (9229) to use.
Note: Although both the host and port have default values, I chose to set them anyway to give you a complete example of command and to prevent some Windows users from encountering problems if they installed Docker by using Docker Toolbox. Indeed, in that case, the Docker container is seen from host as a remote machine and to communicate with it we need to use a public IP, for example 0.0.0.0 or the Docker Machine IP.
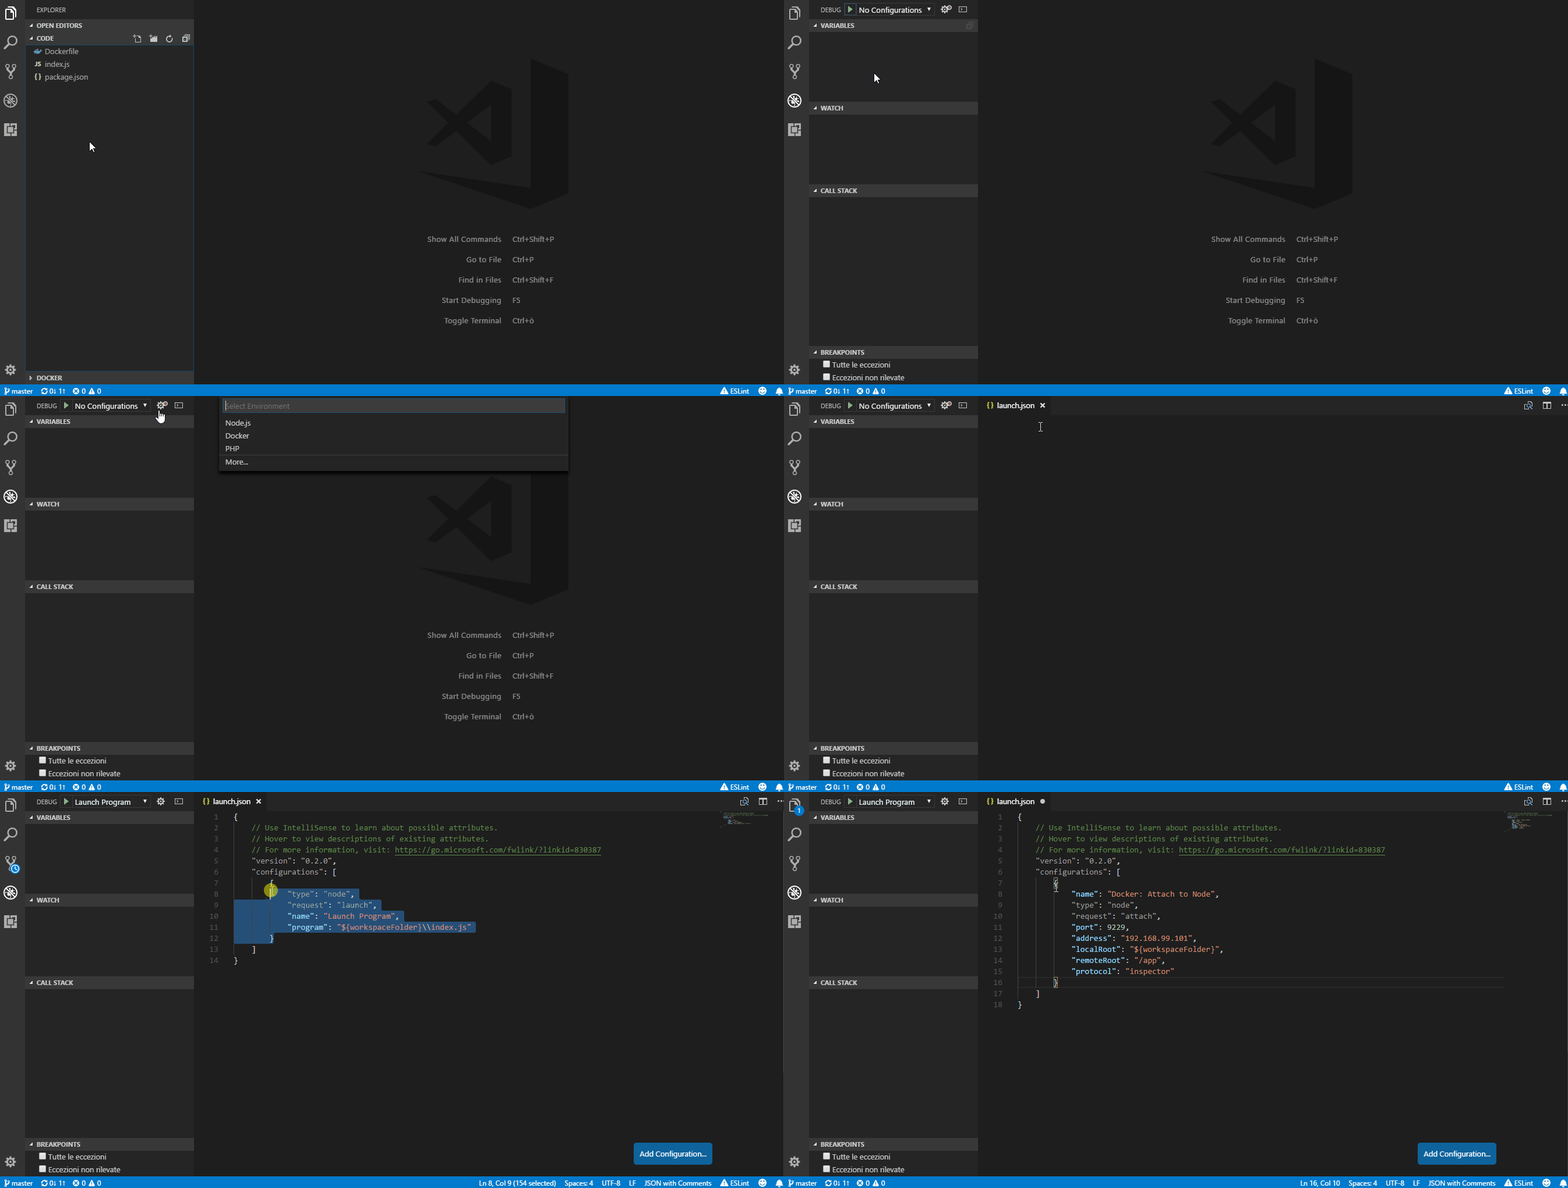
Now we have to configure the debugger. To do open VS Code's debugger section and add the following configuration
{
  "name": "Docker: Attach to Node",
  "type": "node",
  "request": "attach",
  "port": 9229,
  "address": "localhost",
  "localRoot": "${workspaceFolder}",
  "remoteRoot": "/app",
  "protocol": "inspector"
}

Let's get into this configuration:
name: the configuration's name.type: the debugger to use.request: Visual Studio supports two types of requests,attachandlaunch. The first lets debugger to connect to a running process while the second launch the process together with the debugger. I chose the first one because it gives more flexibility, especially when it comes to debugging containerized or remote apps.port: This is the port on which debugger and process will communicate. Don't forget to expose it as well as you do with the port on which the application runs (see below).address: This is the address on which debugger and process will communicate. On systems where Docker was installed by using Docker Toolbox, the address to use is that returned by$ docker-machine ipcommand.localRoot: The application's path in your filesystem. You can use${workspaceFolder}to target the folder where Visual Studio has been opened.remoteRoot: The application's path in the container's filesystem.protocol: The protocol to use for the communication between debugger and process. There are two options,inspectorif the--inspectflag is used orlegacyif a old version of Node.js is used.
Let's start the container exposing the port for the debugger and setting the entrypoint command.
$ docker run -d -p 4000:3000 -p 9229:9229 --entrypoint npm nodejsapp run debug
That's it, now you can Visual Studio to debug your containerized application!
Conclusions
We saw several debugging strategies, each one for one or more use cases. However the most powerful of them remains the live debugging because it allows examining each line of code and the related context easily, conveniently and thoroughly.


